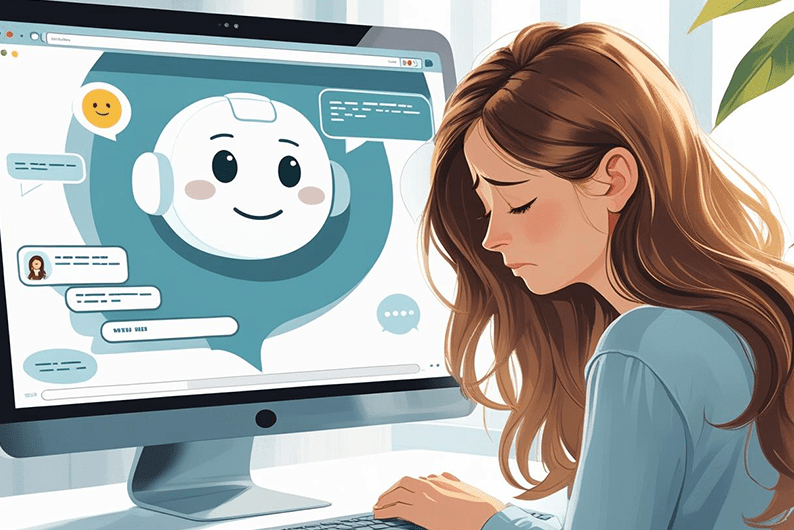
Last week we met with our research group at HEMD for a brainstorm/inspiration session on how designers can contribute to solutions for data bias by developing a specific tool – a potential “data bias detector” or “data bias thermometer”. We’d like to share the results below.

In the meeting we identified two general types of data bias:
- Bias in the collection of data, resulting in a biased data set
- Biased clustering, categorizing, and ranking of the data from the data set (biased parameters, algorithmic bias, biased categories)
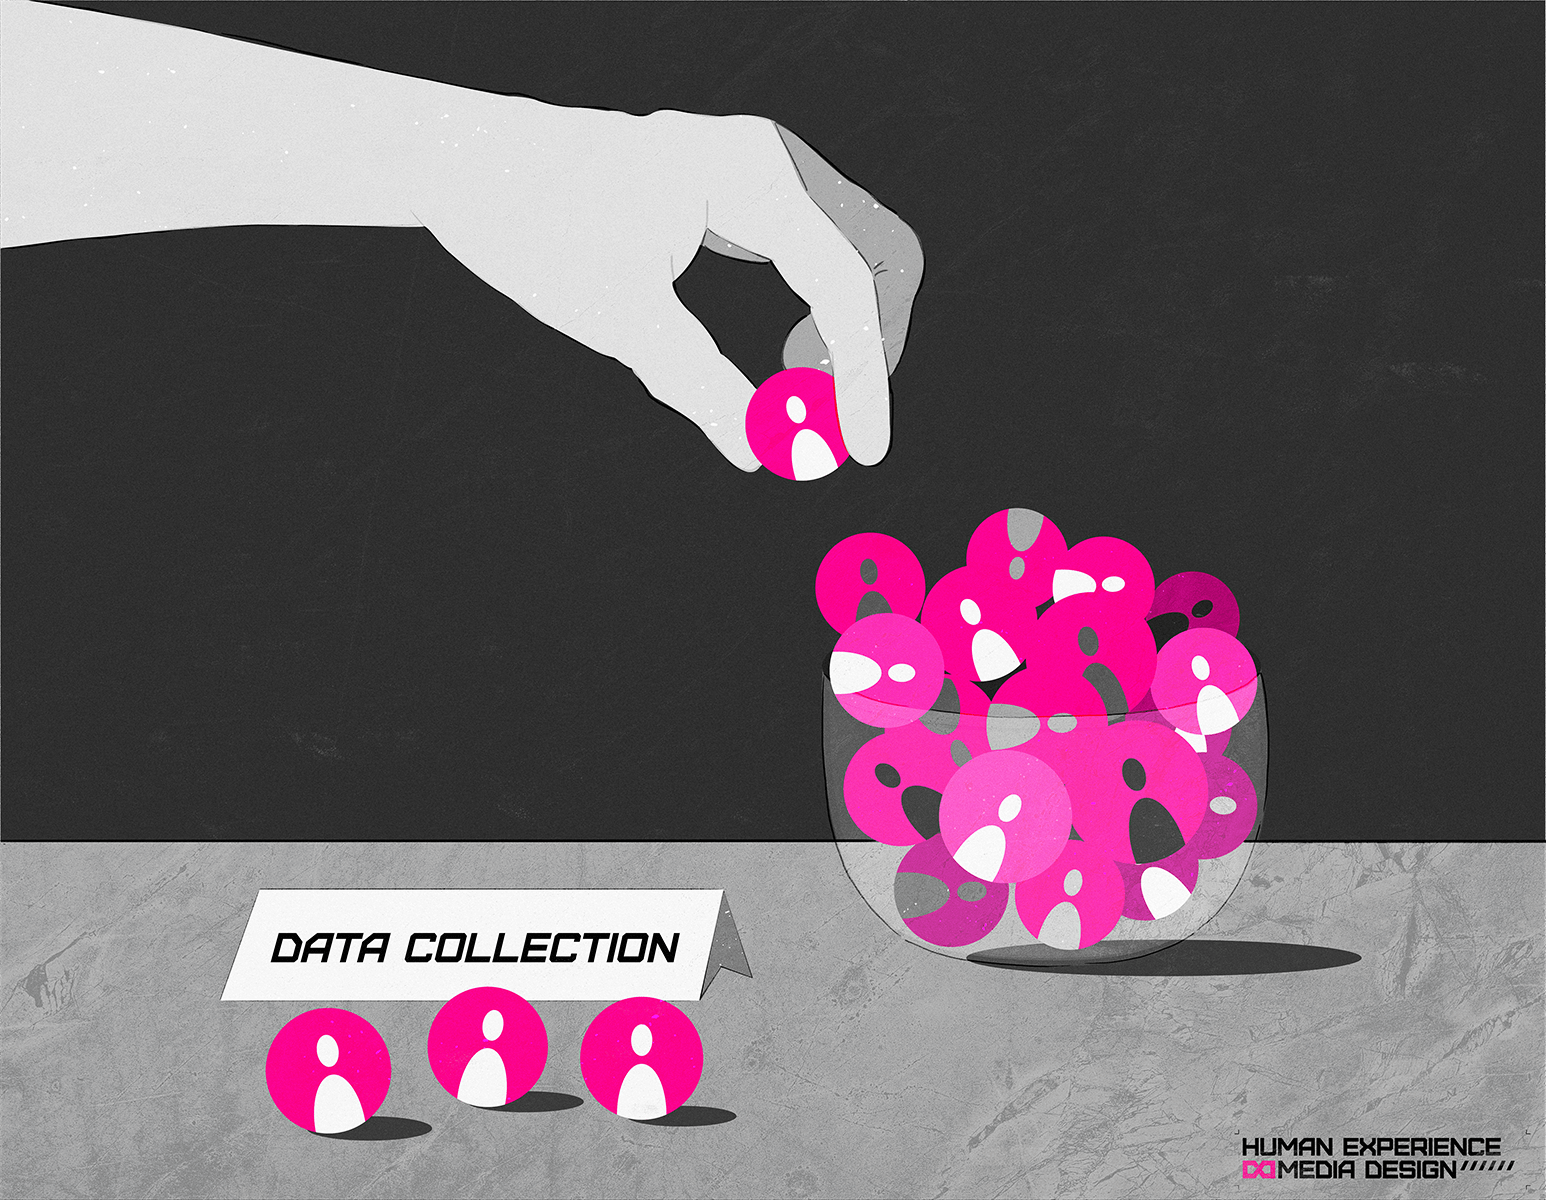
Collection of data
The first category of data bias requires us to rethink how we collect our data. Often, when governments, companies or people design new products or services, they do so because they want to design something that helps people, solves problems, and offers value. To see if it works, they have to test their products or services and collect data. It can be attractive for them to collect data within their existing networks. For instance, to save time and get quick results, a designer might recruit users/respondents for a test from among his/her friends, family, and colleagues. Often, these people share similar characteristics in terms of ethnicity, education, income so on and so forth. We tend to flock together with people that have these things in common with us. The designer then might end up with user data from individuals that actually look more or less the same. Imagine a white designer who has mainly well-educated, middle-class white friends, who themselves have a lot of friends with a similar background, and they all share their data. That data may say a lot about this specific group of people but is nevertheless biased –since it does not represent other potential user groups.
It takes time and money to collect data from a diverse group of people, and sometimes governmental organizations, companies, or individual tech creators don’t have these resources at their disposal. That is why they are likely to just use the data they have on people who are relatively close to them or whom they consider to be the “mainstream”.
An example for the potentially harmful consequences of this comes from Michigan in the United States: there, a study conducted on how well devices, that were developed to measure people’s oxygen levels in their blood, worked. It turned out that the devices had been developed with data from mainly white patients and didn’t work well on those of African-American origin. This means that there is a higher risk that diseases caused by high or low oxygen levels remain undetected for African Americans. Over time, this could become dangerous for the affected demographic group.
Another example of biased data collection concerns corona vaccines. The data on the AstraZeneca vaccine’s effects have mainly been collected from people under the age of 60. This is partly because it could be dangerous for people above 60 to participate in the testing of the vaccine. However, as a result, there are now plenty of people in the 60+ age range who are being vaccinated with the new vaccines and it is not certain how it may affect them as they were not part of the tests.
Clustering, categorizing and ranking of data
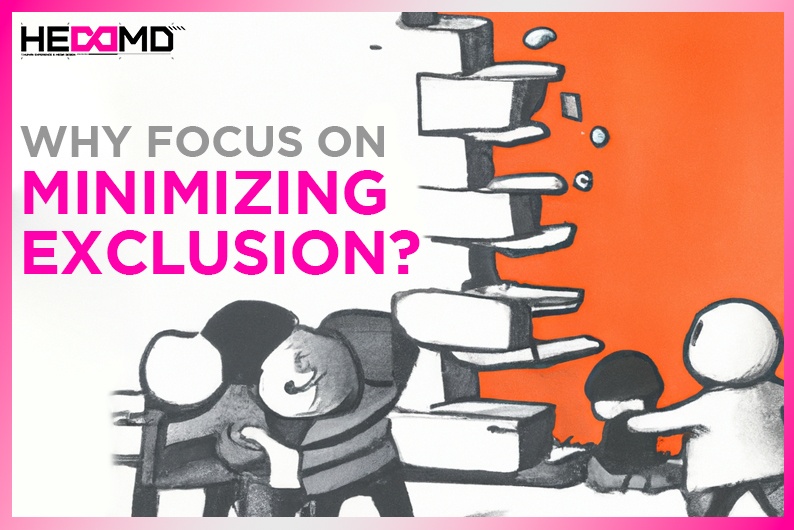
The second category of data bias, spotting the problem within the output, is more difficult to deal with. This concerns data that organizations already have and their overall representativity of the whole population. Examples are government data on taxes or census data. Here the problem is mainly an unfavorable clustering and ranking of data about people. Imagine an algorithm that considers people with a migration background as more prone to commit fraud or residents in certain urban areas more prone to be criminal just because they live there. The algorithms that make decisions about people are guided by the assumptions, goals, and intentions of the organizations that use them. It is handy to have a tool that automatically categorizes and ranks people but what if the algorithm reflects human biases and becomes e.g. racist or sexist? How do we (as designers) gain control over the algorithm?
An important question is: how can designers help organizations with increasing their own awareness for biases in their systems? In the meeting of the research group, our team members pitched concepts and ideas that potentially would help organizations with identifying different forms of bias: based on gender, race, age etc.
The first idea is a so called ‘thermometer’ that would analyze how balanced a data set and/or the clustering of data is and highlight in what areas the data sets could likely be biased. For instance, it could tell the organization: ‘Chance of gender based data bias: 28%’. The decision-makers who have to work with this data can then critically review the output and reduce harm to the people that would be affected by this bias. Conceptually the idea is intriguing and would allow organizations to monitor and assess their data practices, although there are many technical-statistical obstacles to address.
Another idea is to design a tool that could analyze the output and find patterns in the data that has been used, based on a number or a code. If the device finds a bias in the data, it could then send a note to the organization that says: did you know that you sent 90% of your letters to people under the age of 60? This would also allow organizations to double-check their automated systems and intervene before certain groups of people are treated unfairly.
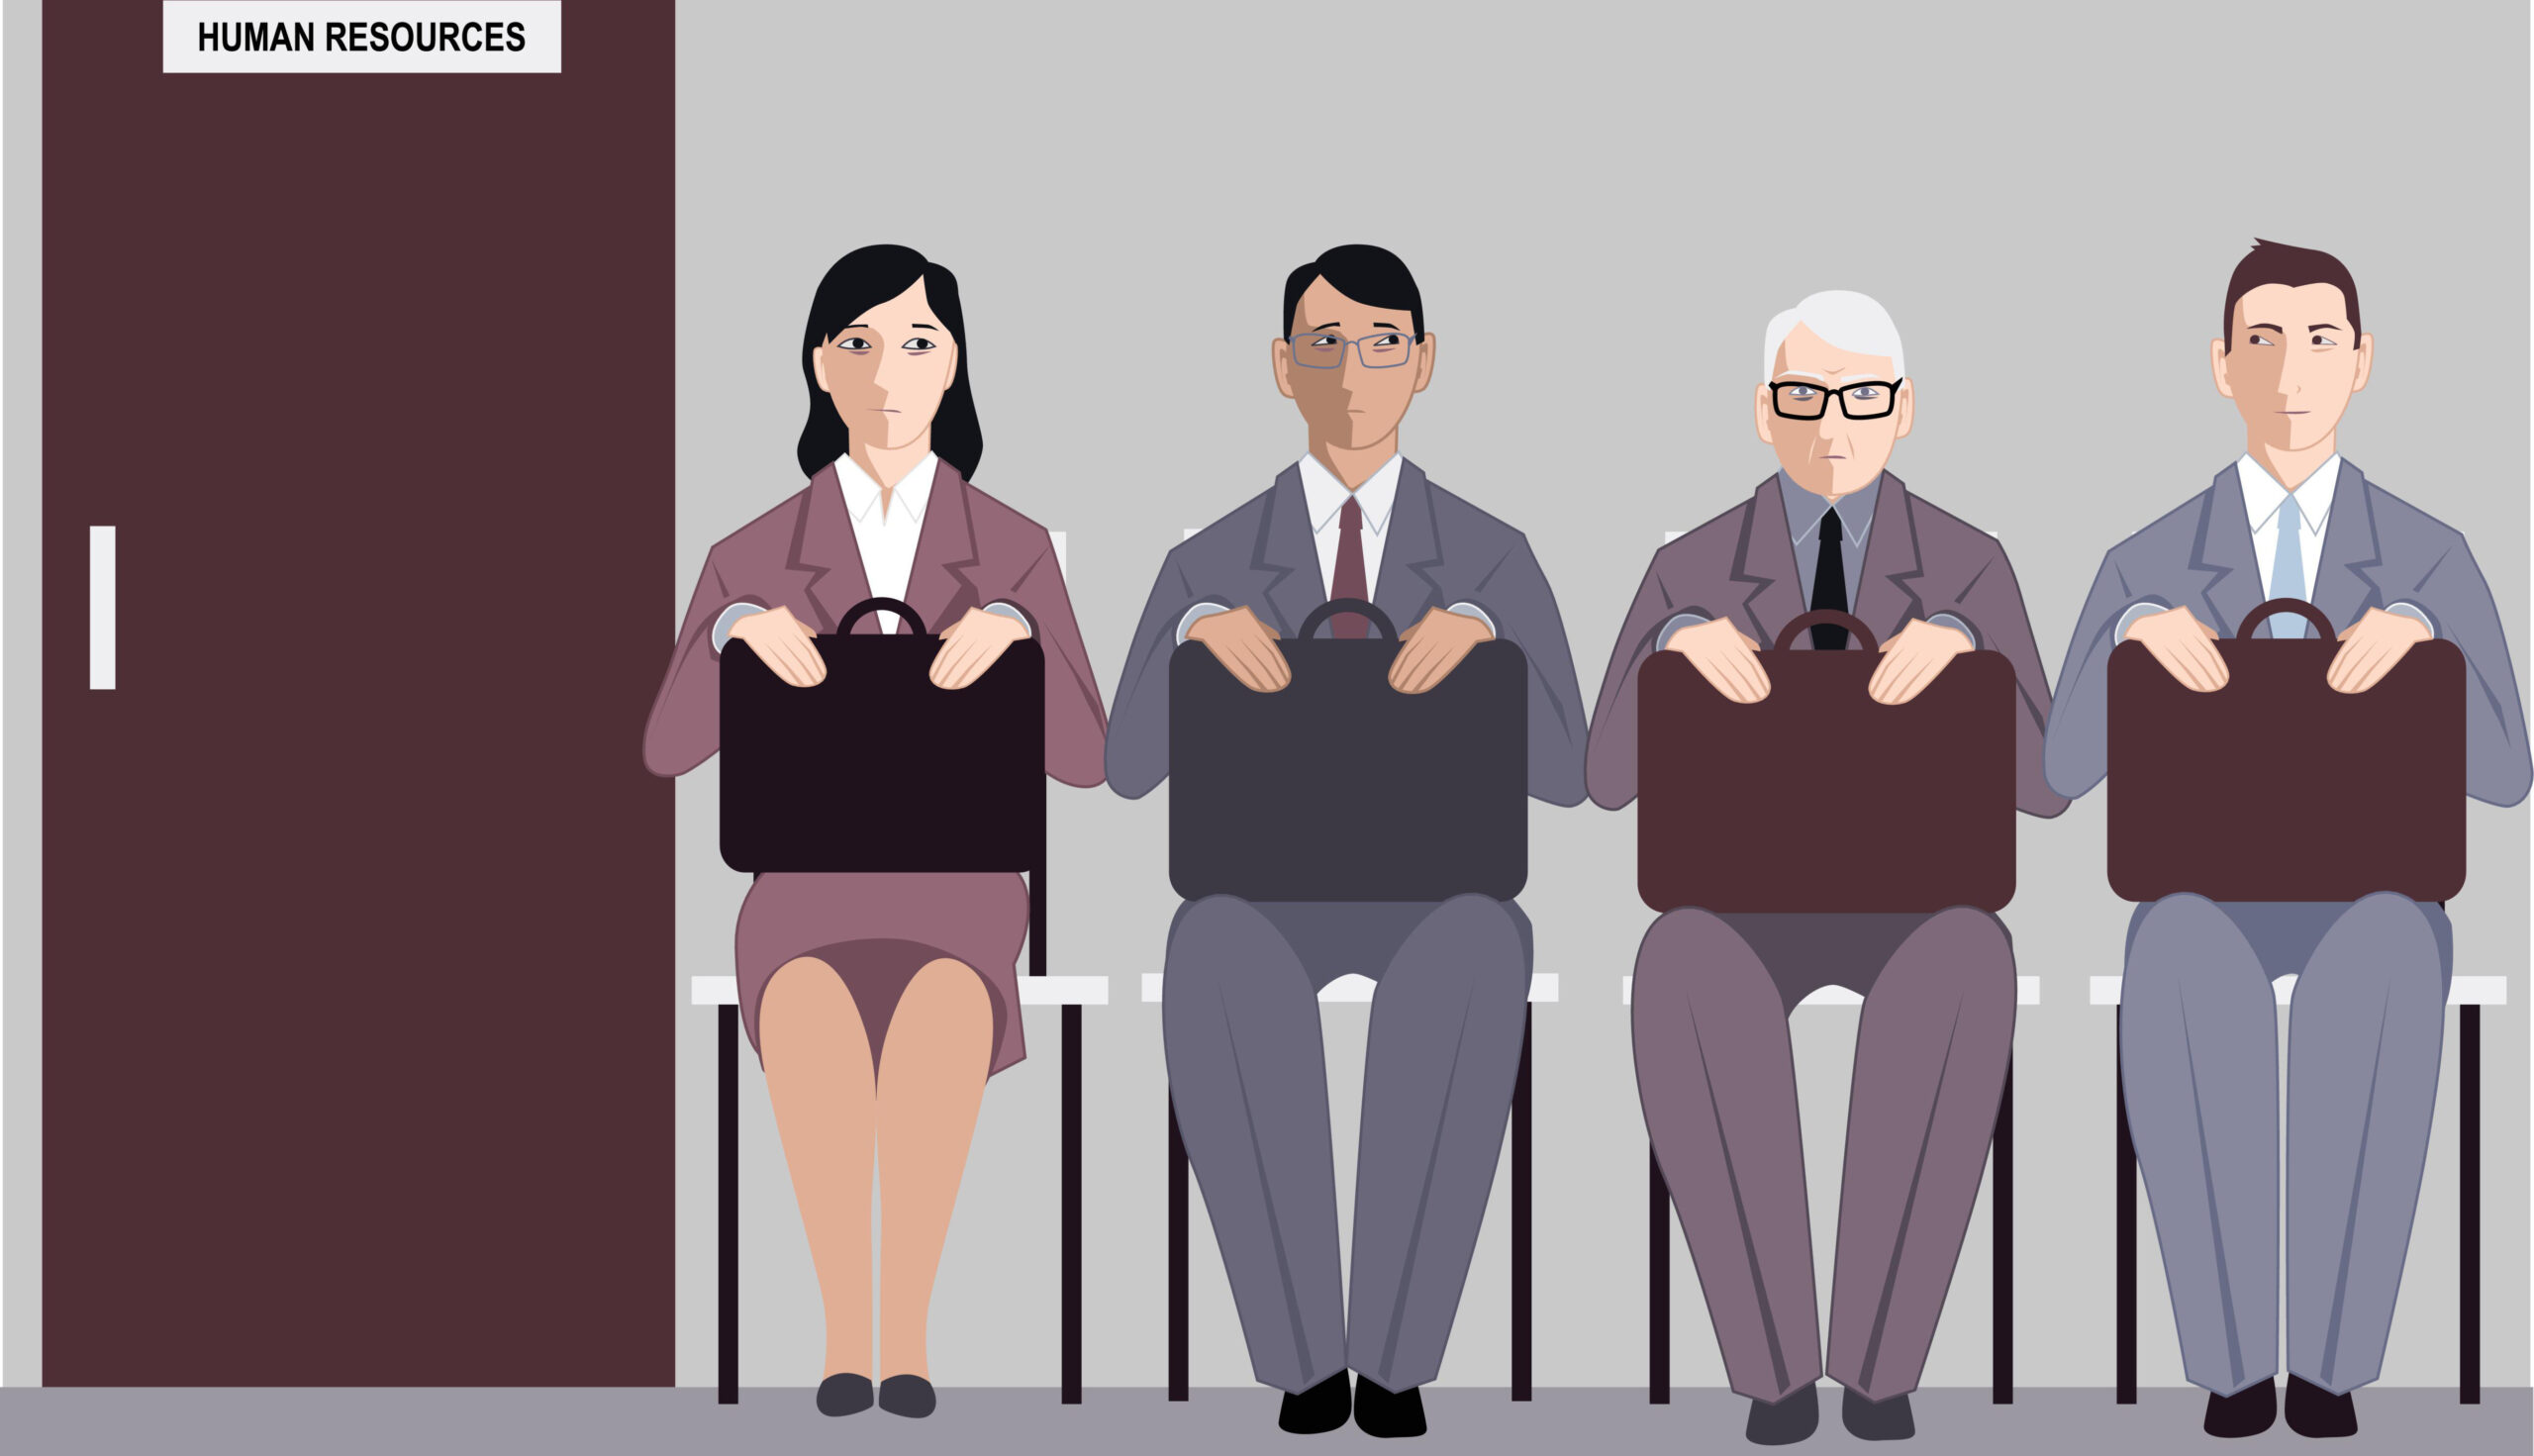
Designers and municipalities
Designers are the ones who create new products and services, based on data that could be biased. Most of the time, they design solutions for specific clients like governmental/public organizations or businesses. For example, we see that municipalities hire designers to design a new product or service for their local residents. There is an increase of digital solutions in public services that aim at providing a better service to citizens but also to make the municipalities work easier. Think of online services to make appointments, request passports, ask for financial support, apps to report problems with trash, or automated systems that send out reminders and fines.
Since these initiatives are often local and have specific goals, they are perfect cases to explore where and how data bias can happen – and how we could prevent it. That is why we at HEMD are looking for municipalities to work together and discover how their plans could be realized and improved.
We are looking forward to discuss ideas on how to help organizations tackle data bias, hearing about existing initiatives, prototypes and first results. Do you have any tips for us? Please contact us at hemdmissies@hu.nl
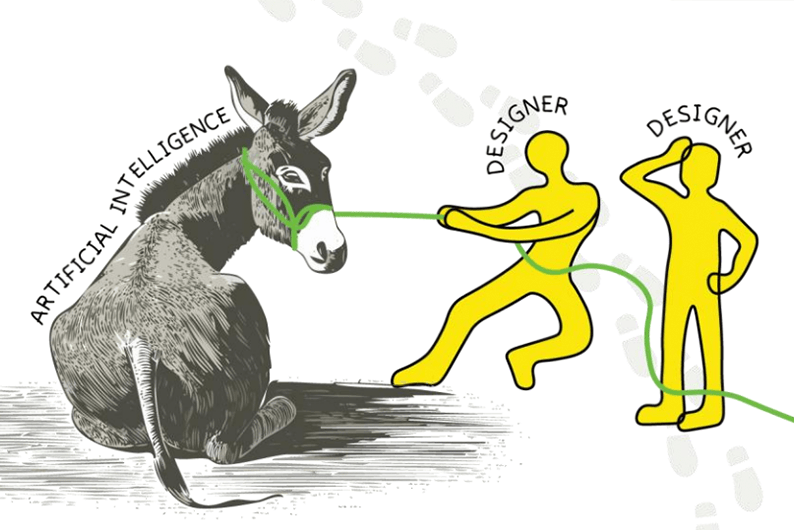
De producties voor deze missie worden ondersteund door redacteur Aaron Golub, illustratie is gemaakt door Natascha van der Vegt
Here you will find all the other items of this mission: